Customer Journey 8 key metrics to measure
Many will say a great customer journey is accomplished with great customer service at every touch point of that journey. Many experts say that creating a great customer experience is simple, you just need to genuinely care about your customer. If it’s so simple, why are so many brands falling down? Perhaps it is because they are not gathering the objective facts measuring their customer journey. Case in point: 80% of companies believe they deliver superior customer service but only 8% of people believe these same companies deliver superior customer service (source: Lee resources). This is a massive disconnect which I believe is occurring because the customer journey is not being measured and looked at as a whole.
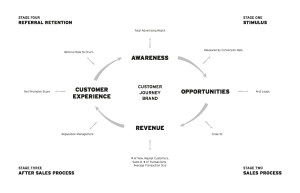
As stated in the blog The four stages of the customer journey, most organizations have four main stages: Stimulus, Sales Process, After Sales Process, Retention & Referral. To truly understand most processes, one needs to be able to measure them. In this “customer age” that organizations now find themselves in, being able to measure your customer’s journey for optimization is the key to success. Capturing data, understanding data, creating insights from data and applying these insights to your organization, if done well, consistently equals a competitive advantage, especially when using data about your customer journey.
At an aggregate level these stages can be measured and looked at through 8 critical KPIs of your organization. So let’s look at each stage’s KPIs, what they tell you and why they are important.
Stage One: Stimulus
In this stage, the customer or client is becoming aware of the organization and the organization’s ability to meet their needs. This awareness is triggered in many ways depending on the industry, products or services. Some organizations rely on repeat business or word of mouth, others conduct acquisition marketing to obtain leads. The Stimulus Stage metrics are about how leads are obtained. By measuring these metrics and optimizing these metrics you can increase the opportunity an organization has.
KPI #1 Reach – The definition of reach is a measurement of customers or clients who are exposed to your offering. Measuring traditional media buys and obtaining digital impressions is an easy first place to start. However, there are other factors to consider such as organizational awareness generating activities like emails sent, organizational physical footprint, prospecting customer touches and customer word of mouth. Some of these can be empirically measured, others will need a reasonable estimate.
What does this KPI tell us? – It tells us how much total promotion activity that the brand is doing by channel. To complete this exercise all the channels need to be tied back to a budget. Anchoring reach of a channel to a budget lets you know the cost of your promotion activity by channel.
Why is this important? – By going through the exercise of measuring all your channels for reach and cost you have your first basic comparison data point: cost per impression. As a marketer this data can be looked at and gas poured on in order to amp up or dial back attention for the brand.
KPI #2 Conversation Rate – Conversation rate is a simply a ratio determined by the # of leads obtained divided by the reach of a channel. For instance a typical online conversation rate is 2.5%.
In order to obtain this conversion rate accurately as a marketing team, you must track your leads obtained by channel. This can be accomplished through call accounting, UTM codes for digital ads or leads by source from a CRM. Your organizations CRM provides a very important data set. In order to be accurate the customer facing staff will need education on the organization’s marketing data needs.
What does this KPI tell us? – With the conversion rate measured you have comparison data on your channels, while with the previous metric you were able to track cost per impression – now with a conversation rate you will know cost per lead. Arguably the purpose of marketing is to create leads so knowing this metric is rather important!
Why is this important? – Clearly knowing what works and what does not work allows a marketer to funnel funding effectively and to objectively review a campaign’s effectiveness. This data allows for A/B testing, offer optimization and channel cost effectiveness comparison based on results, not just mass reach. As a marketer, if you can move your conversation rate up you can increase your organization’s total opportunity.
KPI #3 Leads – The purpose of marketing is to create opportunity and for most organizations opportunity equals leads. In order to measure this KPI the definition of a lead needs to be defined for your organization. I define lead as a prospect that has taken an action showing purchase intent. A prospect that does this will most likely have the need, reason and/or interest in pursuing the product or service. With the definition of a lead defined, now actualized leads need to be monitored and measured. Online form submissions are the first place to start – this is an easy tally. Online chat and social can also capture leads, this is obtained through conversations that draw out prospects and pass them to sales as a lead.
All forms of digital are easy to measure with UTM codes that allow for unique tracking measurement. Call tracking numbers can also be used with print or digital creating unique call tracking numbers for each ad or publication as well as call counting at physical locations and head count monitoring systems for physical traffic. Last but not least, an effectively utilized CRM closes the loop with source attribution. The key is to become obsessive about capturing all leads. Too often legitimate business opportunities are dismissed as not being a valid lead. If all leads were captured, measured and worked, where do you think your business would go?
What does this KPI tell us? – Knowing the amount of leads that come in by channel allows a cost per lead to be calculated for each channel. Also with the help of metrics from the next stage (close percentage; average transaction size) ROI by channel can be calculated. At the end of the day, knowing the total amount of leads coming into your organization = your total new business potential.
Why is this important? – Knowing the performance of each channel allows a marketer to determine where to funnel ad dollars for optimization, additionally knowing the total amount of leads generated showcases a organization’s opportunity and sets the stage for measuring the next KPI, close rate, which measures how much of that opportunity is being captured.
Stage Two: The Sales Process
The sales process begins when there’s contact with a prospect and brand representative that can sell or provide a product or service. Essentially, when a request is received by an organization. The effectiveness of this stage is measured by close rate and revenue KPIs. Total revenue by itself is not an effective KPI. KPIs within the revenue such as new customers versus existing customers, average transaction size and customer Life Time Value tell the story of the total revenue. These KPIs within revenue are needed to complete other KPIs in the customer journey.
KPI #4 Close Rate – Close rate is the percentage of incoming leads that convert into commercial transactions. The challenge for most companies is tracking incoming leads. Sales team members will often claim 40 -50% close rates while industry stat after industry stat will claim that 80% of leads are not closed. Why this disconnect? The disconnect comes in an organization’s customer-facing staff customer qualifying process. A common sales team objection to the “80% of leads never convert” stat is that the leads are no good. The leads are “tire kickers.” Thus, they claim 40 -50% close rate on “hot ones” which are buyers further down the buying funnel. If all leads are quantified (a prospect that has taken an action showing purchase intent) as opposed to prospects that show clear buying signals, a true close percentage will occur, and opportunity to improve will be illuminated.
What does this tell us? – An organization’s or individual’s close presentation tells us so many things, but first and foremost it identifies how much additional opportunity an organization or individual has. If 80 out of 100 leads are going elsewhere, there is an immediate 4X growth opportunity without any additional acquisition marketing needed.
Why is this important? – Measuring your close percentage represents a quick metric that can be improved upon immediately and it will directly and immediately affect your bottom line. With sales training and ongoing sales coaching quick gains can be made. While this is part of the customer journey metrics it is also a people metric. Each individual on the sales team can immediately improve their business and the organization’s customer journey.
KPI #5 – Revenue KPIs – The question that is always asked in business circles is: How’s business? The answer is usually a derivative of sales. Business is good we are experiencing double digit sales growth. That is a simple ten word answer that does not give any understanding as to why or how sales have gone up or down. Revenue is an outcome of activities completed before the sale and to understand the impact of the revenue you need to go deeper than a ten word answer. The following data must be mined so revenue KPIs can be created: # of new customers, # of existing customers, average transaction size for new and existing customers, Life time Value for new and existing customers.
What does this tell us? – By gathering this data we can calculate the ratio of new customers versus existing customers in a given sales period. We can see if the average transaction size and LTV is different for either set of customers.
Why is this important? – There are three bucket of marketing strategy to pour dollars into: Customer Acquisition, Customer Retention, and Customer Upsell and Cross Sell. Knowing these six critical revenue KPIs tells you where to put your marketing dollars; If you have a high ratio of existing customers you may wish to employ acquisition marketing to grow you customer base. If your average transaction size is low for existing customers cross sell and upsell may be a bucket to pour some dollars into. If you have very few existing customers, retention and loyalty may be critical marketing allocations. Finally, knowing the average transaction size allows you to calculate marketing ROI.
Stage Three: After Sales Process
The customer experience is only beginning once you have collected the cheque. The ability of an organization to deal with the customer after the sale is as important as leading up to the sale and sadly is often neglected. This process includes customer satisfaction follow up, product training, warranty requirements and ongoing service requirements and is measured through reviews and a net promoter score.
KPI #6 Reputation Management Ratings – Online reviews are no longer a new thing, they are a fact of life. But they are often mismanaged or left at a distance and sometimes ignored. The main review platforms online for many businesses are Facebook and Google plus overall social listening. As an organization you need to have all your locations independently set up with a Google My Business page and of course have a presence on Facebook. While capturing and managing reviews on social is important, social is also a customer service channel for answering questions, inquiries and complaints, so make sure your channels are monitored and measured for volume of inquiries.
What does this tell us? – Reviews and messages are the voice of the customer. Ratings are applied that tell a brand how they are doing often with explanations. This is a clear indicator of how an organizations staff is treating their customers.
Why is this important? – Through reviews a brand can conduct service recovery for the world to see. How a brand reacts to good or bad reviews helps or detracts from future business. As such, all reviews need to be answered so customers see that a brand is paying attention to their customers. Bad reviews if embraced represent an opportunity for the brand to improve. The reviews also provide empirical evidence to company staff on how they are doing according to the customer and thus can be a marker to gauge progress.
KPI # 7 Net Promoter Score (NPS) – The net promoter score by some has been labeled the most important metric a business can measure. The net promoter score as explained in this blog https://www.wp.stevewhittington.com/net-promoter-system-need/ is the one metric that will measure how likely your customers are to recommend your business, products and services. If all your customers were wowed by your customer experience you would not need marketing, your business would be built on referrals. An interesting thought, as Seth Godin has said advertising is the tax a business pays for poor service.
What does this tell us? – The net promoter score is calculated by taking the percentage of your promoters minus your detractors. The higher the score the higher your likelihood of repeat business and referrals.
Why is this important? – With higher repeat business and referrals, compounding affects occur. First, you will be able to increase your Life Time Value of your customer base. By keeping that customer base loyal, to grow the business you simply keep marketing to add more customers if the market size can allow for this. This customer base growth will occur easily with a high net promoter score and referrals.
Stage Four: Retention and Referral
One of the three main categories of marketing is customer retention or loyalty marketing. It is in stage four of the customer journey that a brand applies loyalty marketing. There are many ways to do this but mostly it involves creating ongoing touches to ensure the customer needs are looked after quickly and fairly after a sale or service, and future needs are anticipated and considered. The brand needs to legitimately care about their customers and this is truly accomplished with authentic individualized ongoing communication.
KPI # 8 Customer Churn – Customer Churn is the amount of customers in a given time period that are repeat customers. It measures the amount of customers that an organizations loses. For instance, if you had 100 customers in time t and in the next period time t+1 you had 80 of those customers do repeat business with you, your churn is 20%. 100 – 80 = 20 lost customers. 20/100 = 20%
What does this tell us? – Customer Churn educates a brand on their retention rate or repeat business rate of their customers. It provides guidance for where an organization should be placing marketing dollars to help grow the business.
Why is this important? – If an organization knows its churn rate it can use this to focus efforts based on the nature of its industry. If there is a high life time value of a customer, retaining customers is a critical battle ground for a brand. If customers can be continually acquired and retained at a higher rate that equals a recipe for growth.
Pulling it all together
Imagine you are marketer tasked with growing the business and you knew the following for time period t
| Reach : | 5,000,000 impressions |
| Conversion Rate : | 1.3% |
| Leads : | 65,000 |
| Close Rate: | 15% |
| Revenue: | $12,187,500 |
| Average Transaction size: | $1250 |
| Customers: | 9750 |
| Reputation Rating: | 3.5 out of 5 |
| NPS: | 41 |
| Churn: | 70% |
What could you do? What would you do?
- Clearly you can quickly grow the business by increasing the close rate or reducing the churn, perhaps you could move the conversion rate up to 1.6 % with better offers or maybe there is more money available to increase reach.
- Imagine with sales and service training you could quickly increase the close rate by 3% and reduce churn by 5% leaving everything else as is. You would immediately gain 1950 customers through the sales process and keep 487 more customers during retention and referral.
- These are all short term gains that would equal $2.4 M more in sales, and long-term initiatives of customer service training and retention processes will further reduce the churn and increase your reputation rating that will lead to a higher NPS, which will lead to more customer acquisition.
All the data points are connected. The customer journey is not a linear line it is wheel that goes around and around and along the way as a marketer you can tweak stages and measure the outcomes to gauge improvement and by doing so create break through growth. What gets measured gets managed and if it is measured by a marketer it gets optimized.
Steve Whittington is President of Roadmap Agency Inc. He has also served for over a decade as a member of the Executive Team of Flaman Group of Companies an award-winning organization and has over 25 years of executive experience. Steve’s current board work includes serving as; President of Glenora Child Care Society; and Co-Chair of the Marketing Program Advisory Committee for NAIT’s JR Shaw School of Business. Previous notable board work included, Chair of the board for Flaman Fitness Canada, a national retailer, a Director for a meal prep internet Startup Mealife and Chair of Lethbridge Housing authority, the third-largest Social housing NGO in Alberta.
Academically, Steve was an instructor of Project Management at Lethbridge College for seven years. Steve holds a Bachelor of Commerce Honours degree; he is a Certified Sales Professional (CSP), Project Management Professional (PMP), Certified Marketing Specialist (CMS) and (CCXP) Certified Customer Experience Professional.
Steve’s first book Thriving in the Customer Age – 8 Key Metrics to Transform your Business Results teaches about the customer journey and provides a guiding framework spanning all stages of the customer experience. The book explains how every metric impacts an organization and how leaders can best utilize each metric to provide a stellar customer experience. Everyone knows the customer is the most important part of a business. This book provides the tools to improve an organization’s customer experience and drastically transform business results.
Recently Steve’s Blog has been profiled as one of the Top 75 Customer Experience blogs